Fibonacci
 SPECIAL
Introduction to Fibonacci levels
The use of Fibonacci levels in trading is perhaps one the best examples of the core philosophy of Technical Analysis and the belief of many, that trading decisions can be made purely from studying the charts and without
the need for Fundamental Analysis.
Fibonacci numbers, when used to measure price swings in the markets, present powerful levels to watch for potential reversals and are applied in technical analysis through
two main studies: Fibonacci retracement and Fibonacci expansion.
Ready to become an expert?
Learn More
Analysis
1. Fibonacci Forex Analysis
Fibonacci analysis is a great way to improve your analytical skills when trying to identify support and resistance levels. It
The number series starts with 0 and then is continued by summing the previous two numbers in the series. For example, here are the first few Fibonacci numbers.
0, 1, 1, 2, 3, 5, 8, 13, 21, 34, 55, 89, 144, 233, 377, 610, 987, 1597, 2584…
As
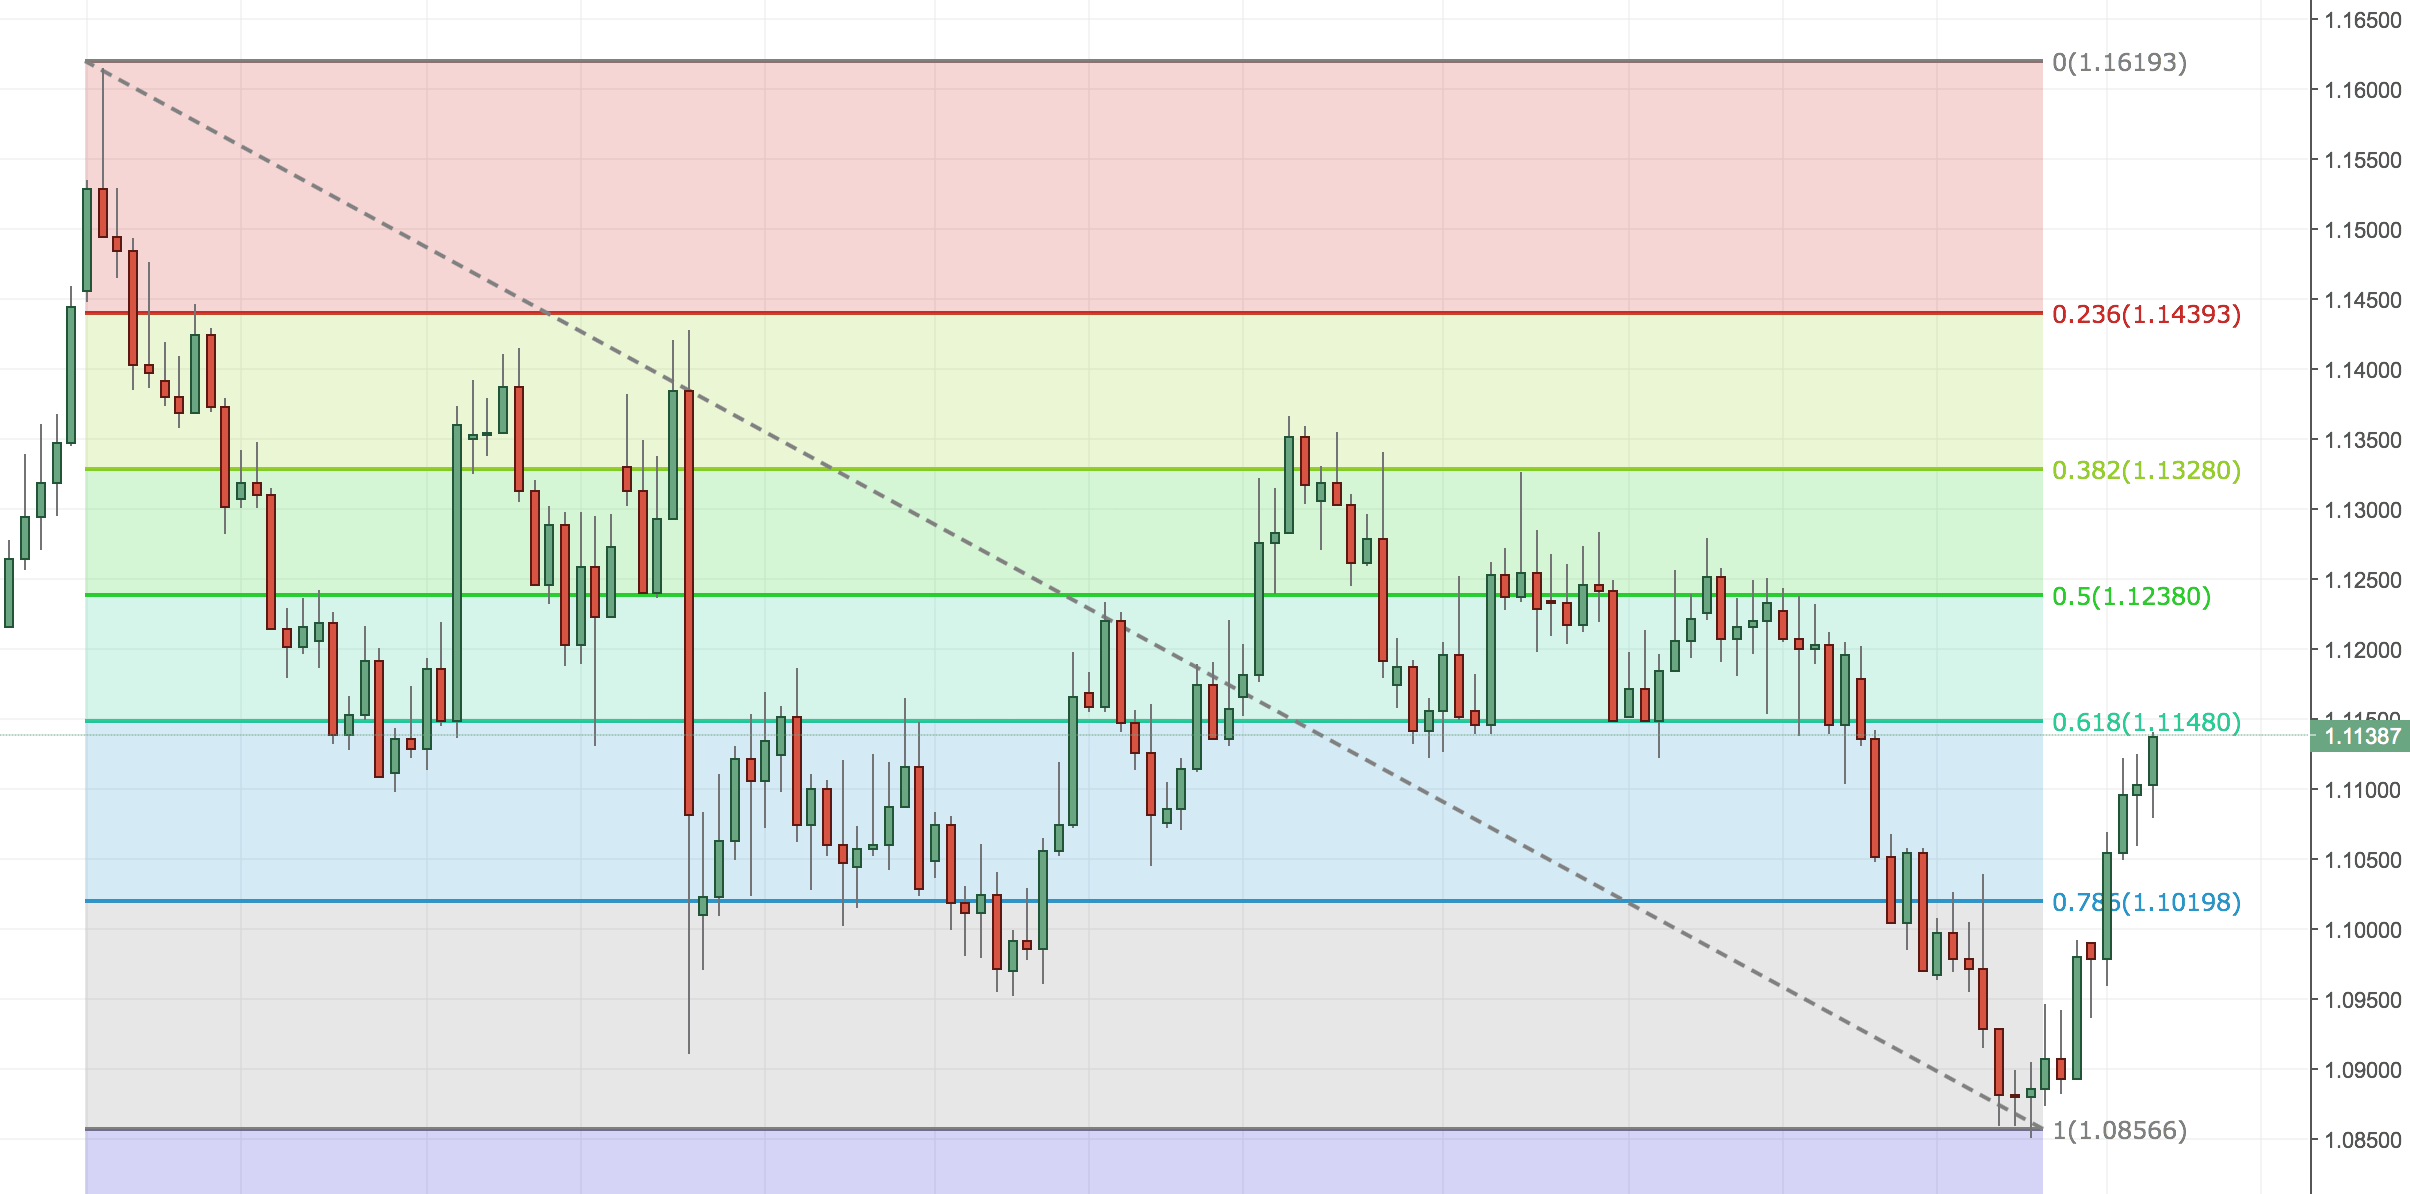
The most popular ratios or levels are 23.6%, 38.2% and 61.8%. There are other ratios that can be used but it is up to you to decide how far you want to take the analysis. In addition to this
How To Use The Fibonacci Trading Method
You'll need to follow some basic forex trading rules. First, discover whether you are in an uptrend or downtrend. Then, figure out the highest and lowest swings in the chart formation. Finally, make the trend your friend by trading on it.
Fibonacci retracement tools help you determine your entry and exit points. When you use a widget, you're trying to figure out how far will the price retrace and then reverse in the opposite direction. To get your retracement levels, you'll need to use a Fibonacci calculator. This will tell you levels for 0 percent, 23.8 percent, 38.2 percent, 50 percent, and 61.8 percent.
To be safe, the price must touch 5 WMA. Typically, you'll want three Fibonacci retracement levels. However, the top must not fail. For example, if you had retracement levels of .382, .500, and .618, then you would not want the .618 level to fail. You'll also want to define extension ratios so that you know when to take your profits. Set your stop order 4 to 5 pips above your Fibonacci retracement level in a downtrend and 4 to 5 pips below in an uptrend.
Caution
Many forex traders are quantitatively inclined. However, when you trade based solely on technical analysis, you might be leaving out some important data (and information). Technical analysis does not account for political instability, major news events, and other information that can dramatically influence currency trends.
There is no one tool or method that will work 100 percent of the time. The theories about market movement, using technical analysis, are based on pure mathematical analysis. If the assumptions being made are wrong, then the trade will turn against you. Don't think for a minute that a trend means you're guaranteed profit. By the same token, don't ignore trends as meaningless. What's important is to assume that the Fibonacci sequence will work when the trend is already there in your favor. All this strategy will do is give you yet another way to determine entry and exit points so that you can set some type of rules for yourself. You should use Expansion Levels as a way of estimating where the where the movement will eventually reach.
Fibonacci expansion basically has two critical levels, firstly at 61.8% and secondly at 100% profit taking level. The purpose of these specific levels are solely aimed at where you should use the information to take a profit. From the example chart shown below the levels are plotted between points 1, 2 and then 3. Following the direction of Forex trend, in this example it is upward, the expansion is then also plotted upwards. You will note that this levels are shown above the price , giving an indication of the profit taking areas. From the example used, working on expansion 100, a healthy profit would have been generated. Good advice would be to practice your strategies and hone your skills in this area. You can do this by finding a Forex chart and plotting your way to a profit, something you should quickly be able to do in real time. Here is an example of expansion levels on an upward forex trend and you can also search out examples of how the strategy works on a downward trend, as the same principle applies of following a trend up or down.
2. Videos About Fibonacci Trading Method
This recording is from the Atlanta Meetup group where we discussed Trading with Fibonacci levels
In the meetup, we covered the following topics with:
- 1. What are the Level?
- 2. What are the other key levels to use with Fibonacci Level?
- 3. Pro/Cons with all the Key Levels.
- 4. Entry levels.
- 5. Profit Target Levels
- 6. Situations with Multiple Wave patterns
- 7. Money Management i.e Reward/Risk
- 8. Where to place Stops Risk Disclaimer.
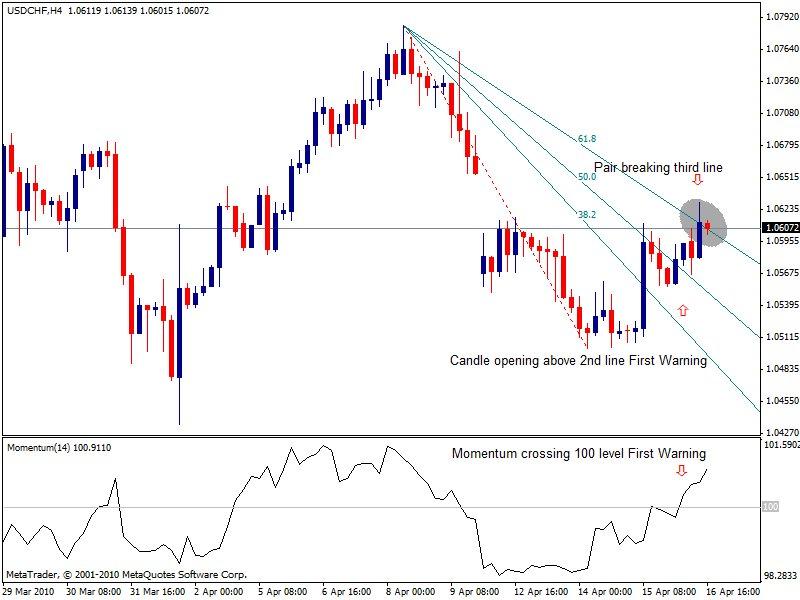
These ratios are a very popular tool among technical traders and are based on a particular series of numbers identified by mathematician Leonardo of Pisa in the thirteenth century.
For some reason, these ratios seem to play an important role in the financial markets, just as they do in nature. The fans are a charting technique consisting of diagonal lines that use these ratios to help identify key levels of support and resistance. They can be used to determine critical points that cause a price to reverse.
One of the most effective ways of using them is to determine the extent of a pullback. Due to its characteristics, one can estimate if a pullback will be a mere Fibonacci retracement, or will it turn into a reversal of the existing trend.
Speaker: Ian Coleman
Is it possible to develop a ‘trading system’ purely based on levels and price action. Ian is going to highlight the strength of pull back and extension levels combined with ‘price action’ (the formation of reversal patterns) at key levels. This will be based on the Elliott wave theory, but also many symmetrical patterns.
Speaker: Phil Newton.
Phil Newton presents a different view of trading that he uses when break outs are not available. With the current market volatility, this is pretty much the only way that Phil is trading to take advantage of the big swing and to identify a method to jump on board some of the moves. The presentation starts with a short power point of Fibonacci and how Phil uses them as well as the strategy outline.